JavaScript Start-up Performance
As web developers, we know how easy it is to end up with web page bloat. But loading a webpage is much more than shipping bytes down the wire. Once the browser has downloaded our page’s scripts it then has to parse, interpret & run them. In this post, we’ll dive into this phase for JavaScript, why it might be slowing down your app’s start-up & how you can fix it.
Historically, we just haven’t spent a lot of time optimizing for the JavaScript Parse/Compile step. We almost expect scripts to be immediately parsed and executed as soon as the parser hits a <script> tag. But this isn’t quite the case. Here’s a simplified breakdown of how V8 works:
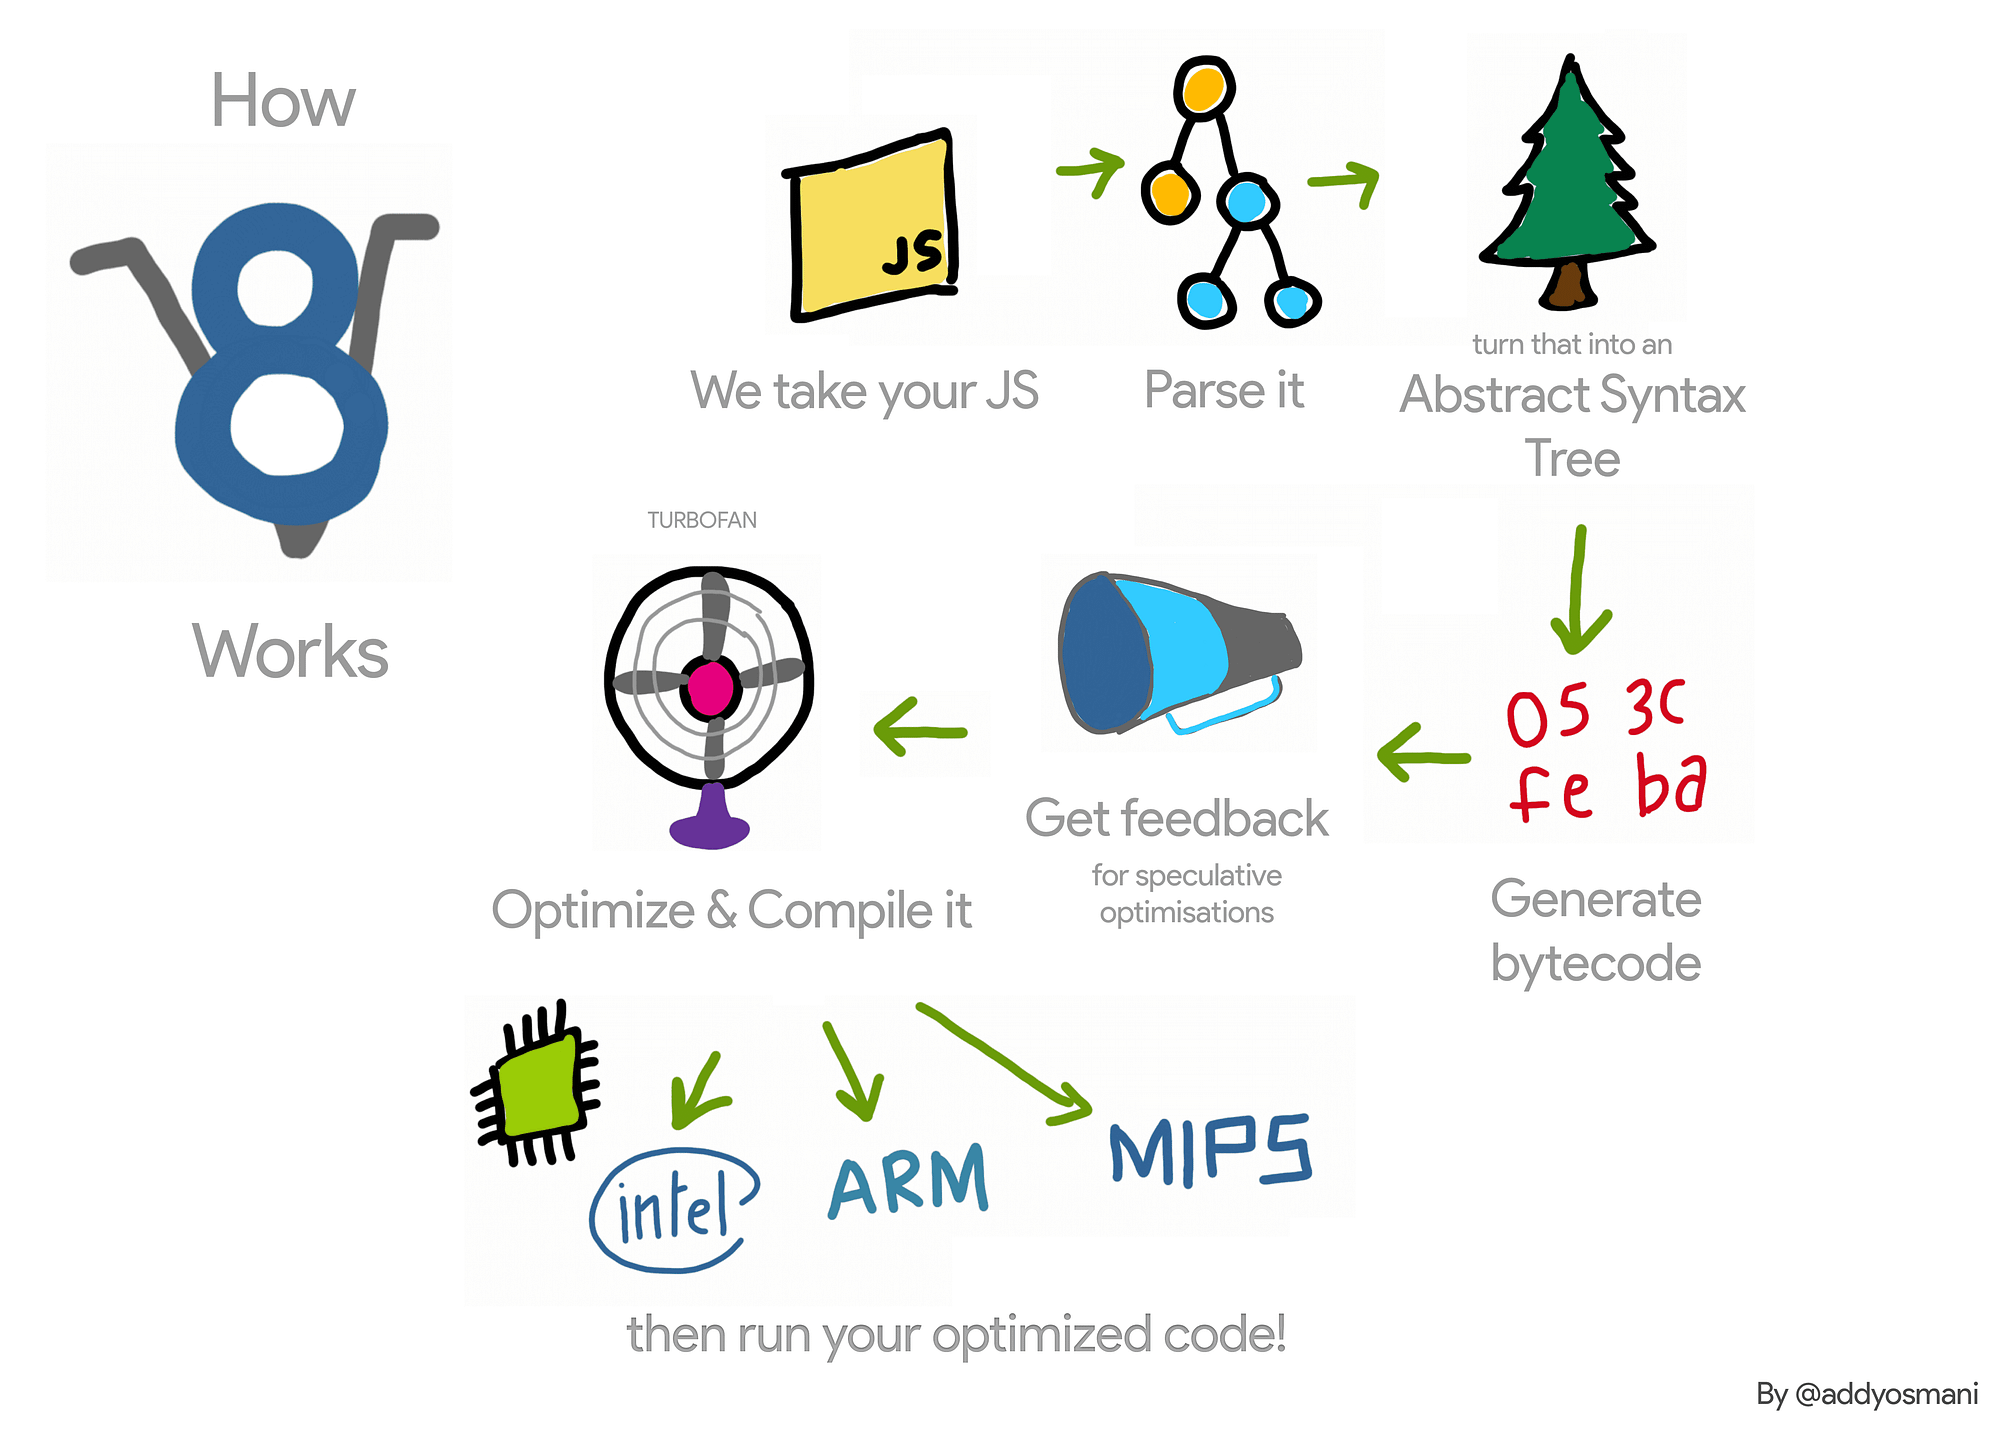 A simplified view of how V8 works. This is our idealized pipeline that we’re working towards.
Let’s focus on some of the main phases.
What slows our web apps from booting up?
Parsing, Compiling and Executing scripts are things a JavaScript engine spends significant time in during start-up. This matters as if it takes a while, it can delay how soon users can interact with our site. Imagine if they can see a button but not click or touch it for multiple seconds. This can degrade the user experience.

Start-up times matter for performance-sensitive code. In fact, V8 - Chrome’s JavaScript engine, spends a large amount of time parsing and compiling scripts on top sites like Facebook, Wikipedia and Reddit:
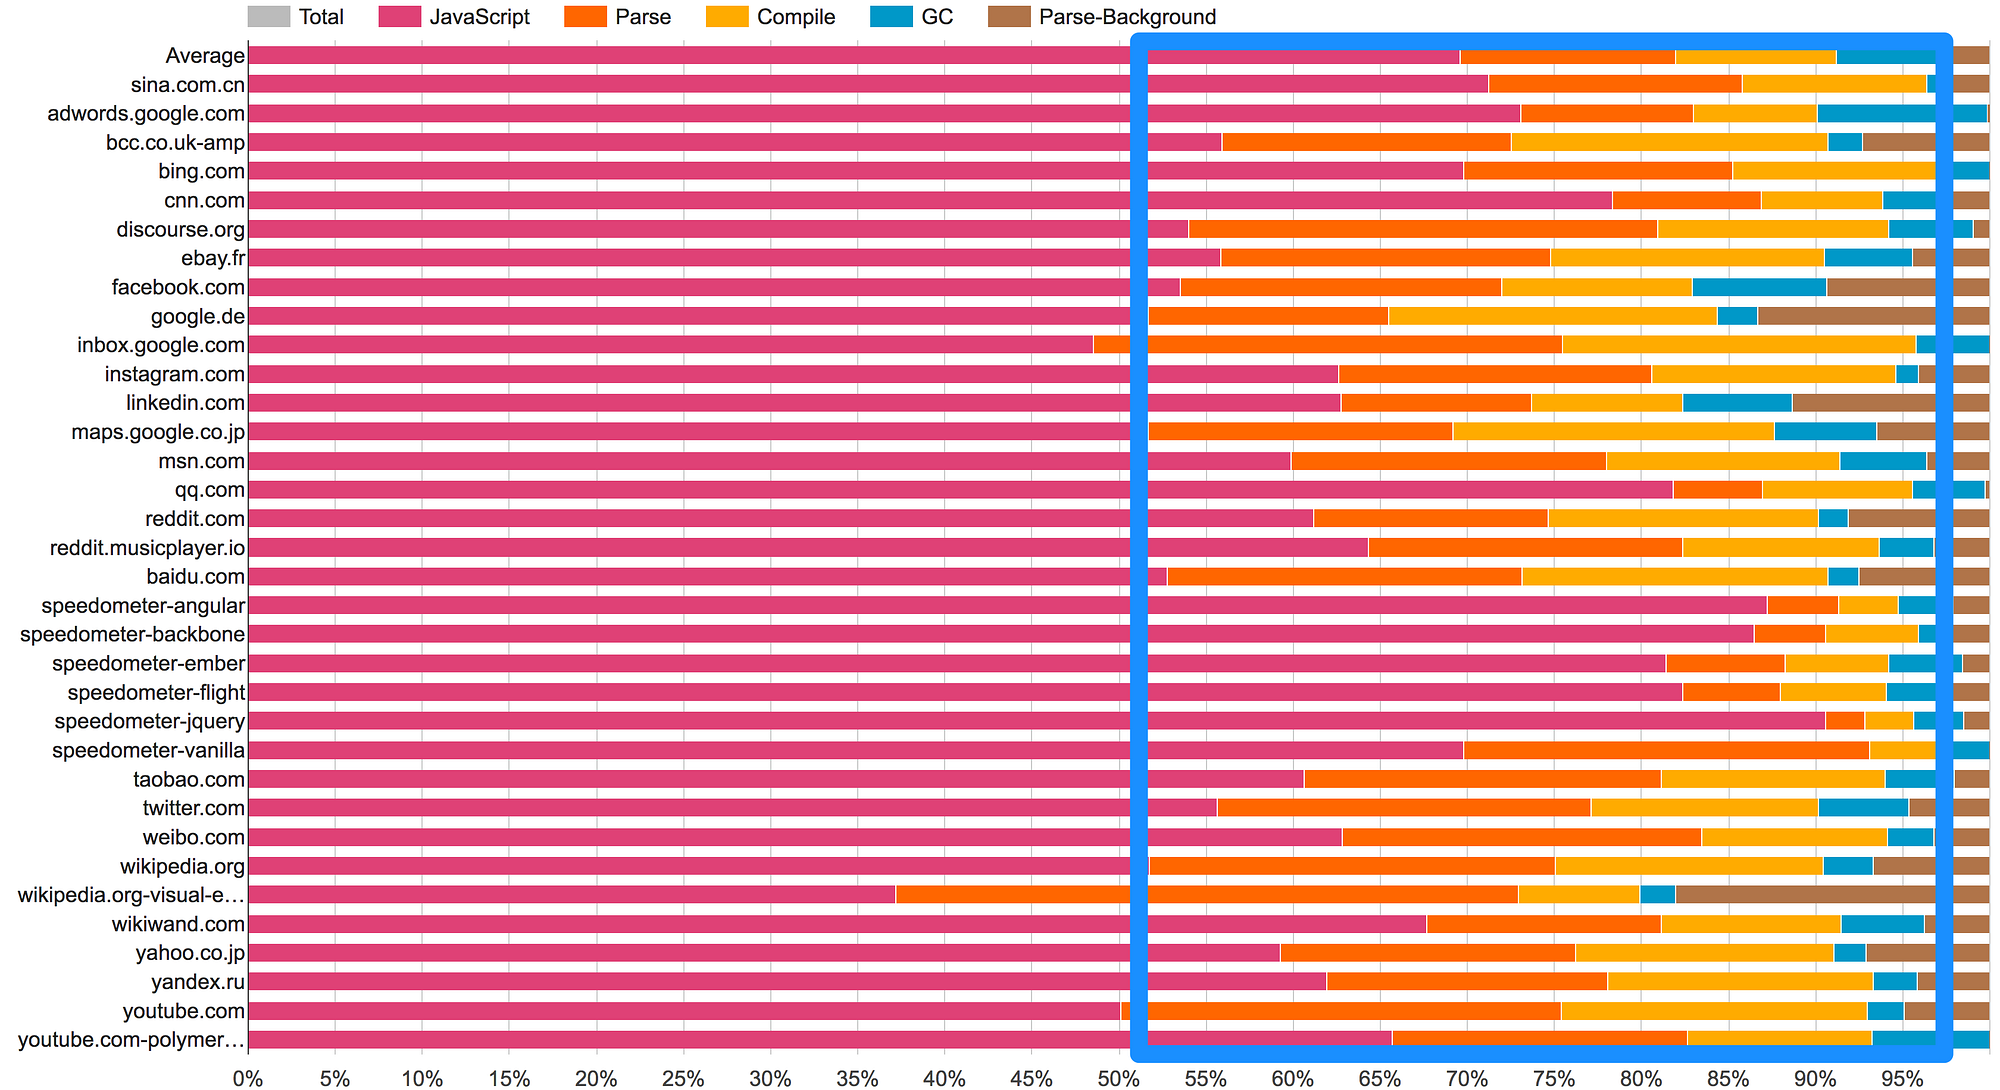 The pink area (JavaScript) represents time spent in V8 and Blink’s C++, while the orange and yellow represent parse and compile.
Parse and Compile have also been highlighted as a bottleneck by a number of large sites & frameworks you may be using. Below are tweets from Facebook’s Sebastian Markbage and Google’s Rob Wormald:
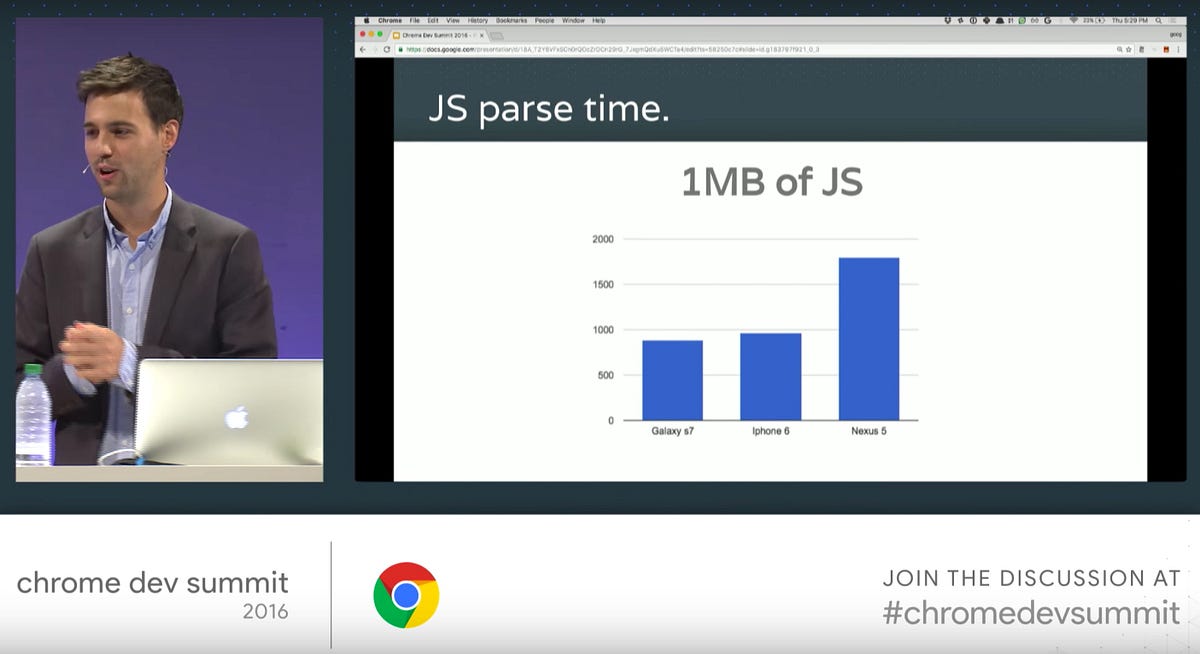 Sam Saccone calls out the cost of JS parse in ‘Planning for Performance’
As we move to an increasingly mobile world, it’s important that we understand the time spent in Parse/Compile can often be 2–5x as long on phones as on desktop. Higher-end phones (e.g the iPhone or Pixel) will perform very differently to a Moto G4. This highlights the importance of us testing on representative hardware (not just high-end!) so our users’ experiences don’t suffer.
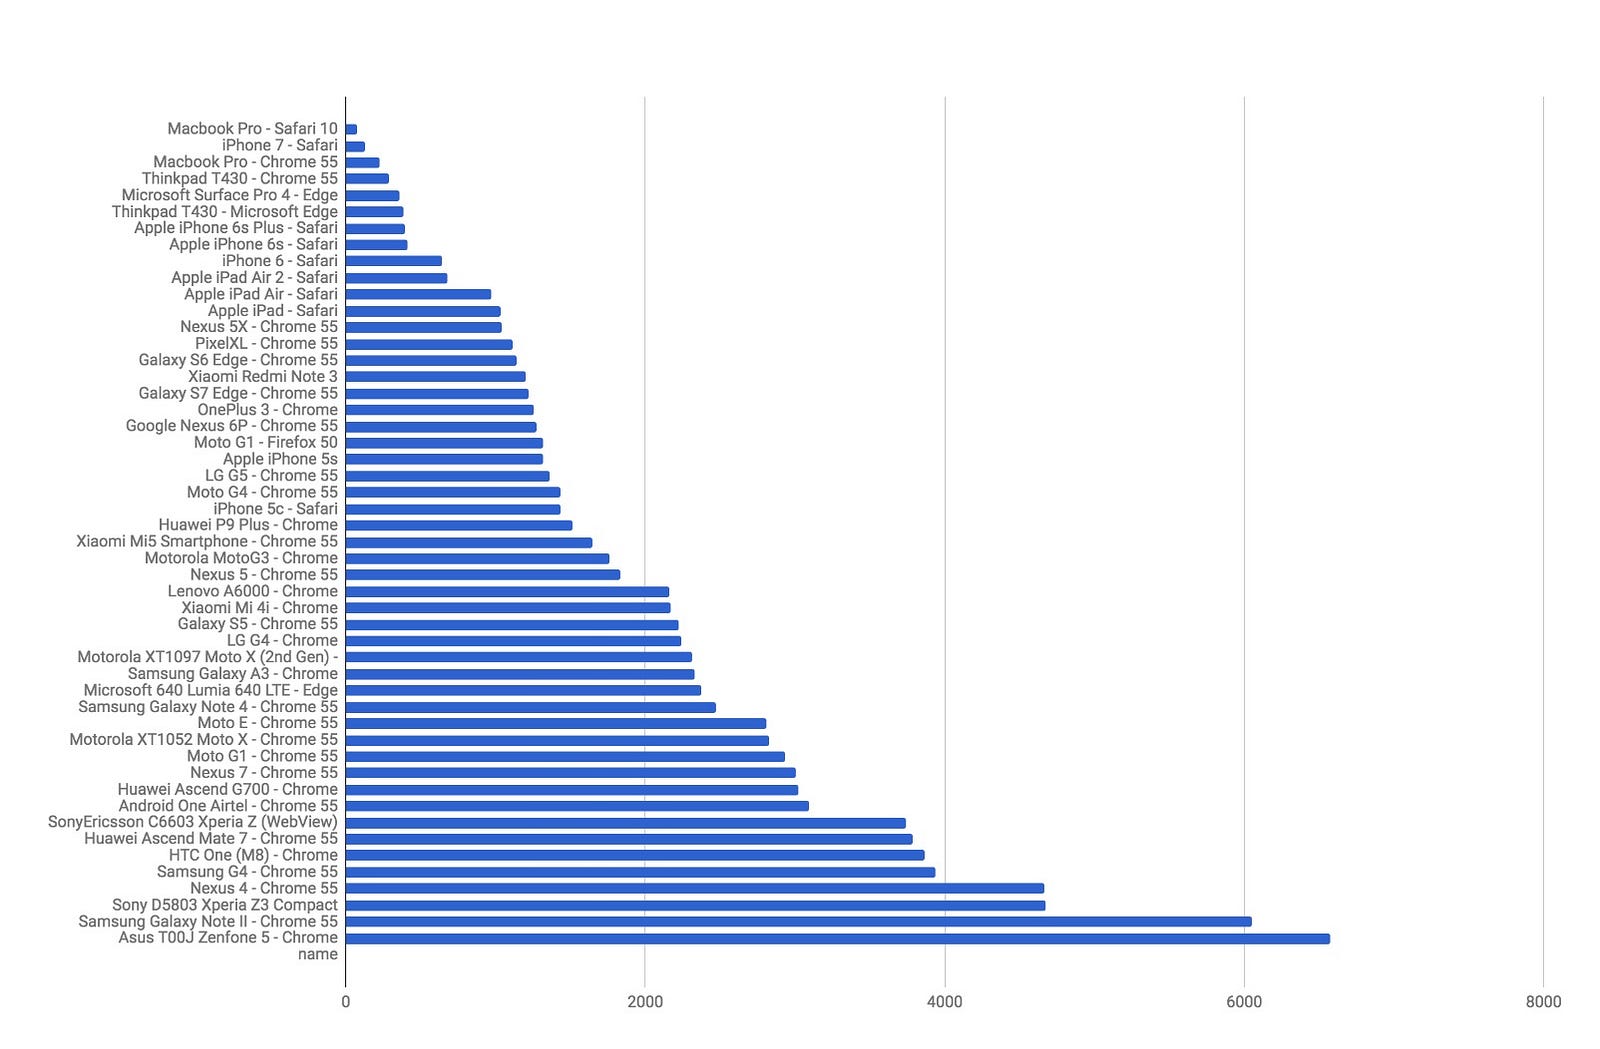 Parse times for a 1MB bundle of JavaScript across desktop & mobile devices of differing classes. Notice how close a high-end phone like an iPhone 7 is to perf on a Macbook Pro vs the performance as we go down the graph towards average mobile hardware.
If we’re shipping huge bundles for our app, this is where endorsing modern bundling techniques likecode-splitting, tree-shaking and Service Worker caching can really make a huge difference. That said, even a small bundle, written poorly or with poor library choices can result in the main thread being pegged for a long time in compilation or function call times. It’s important to holistically measure and understand where our real bottlenecks are.
What Are JavaScript Parse & Compile bottlenecks for the average website?
“Buuuut, I’m not Facebook”, I hear you say dear, reader. “How heavy are Parse & Compile times for average sites out in the wild?”, you might be asking. Let’s science this out!
I spent two months digging into the performance of a large set of production sites (6000+) built with different libraries and frameworks — like React, Angular, Ember and Vue. Most of the tests were recently redone on WebPageTest so you can easily redo them yourself or dig into the numbers if you wish. Here are some insights.
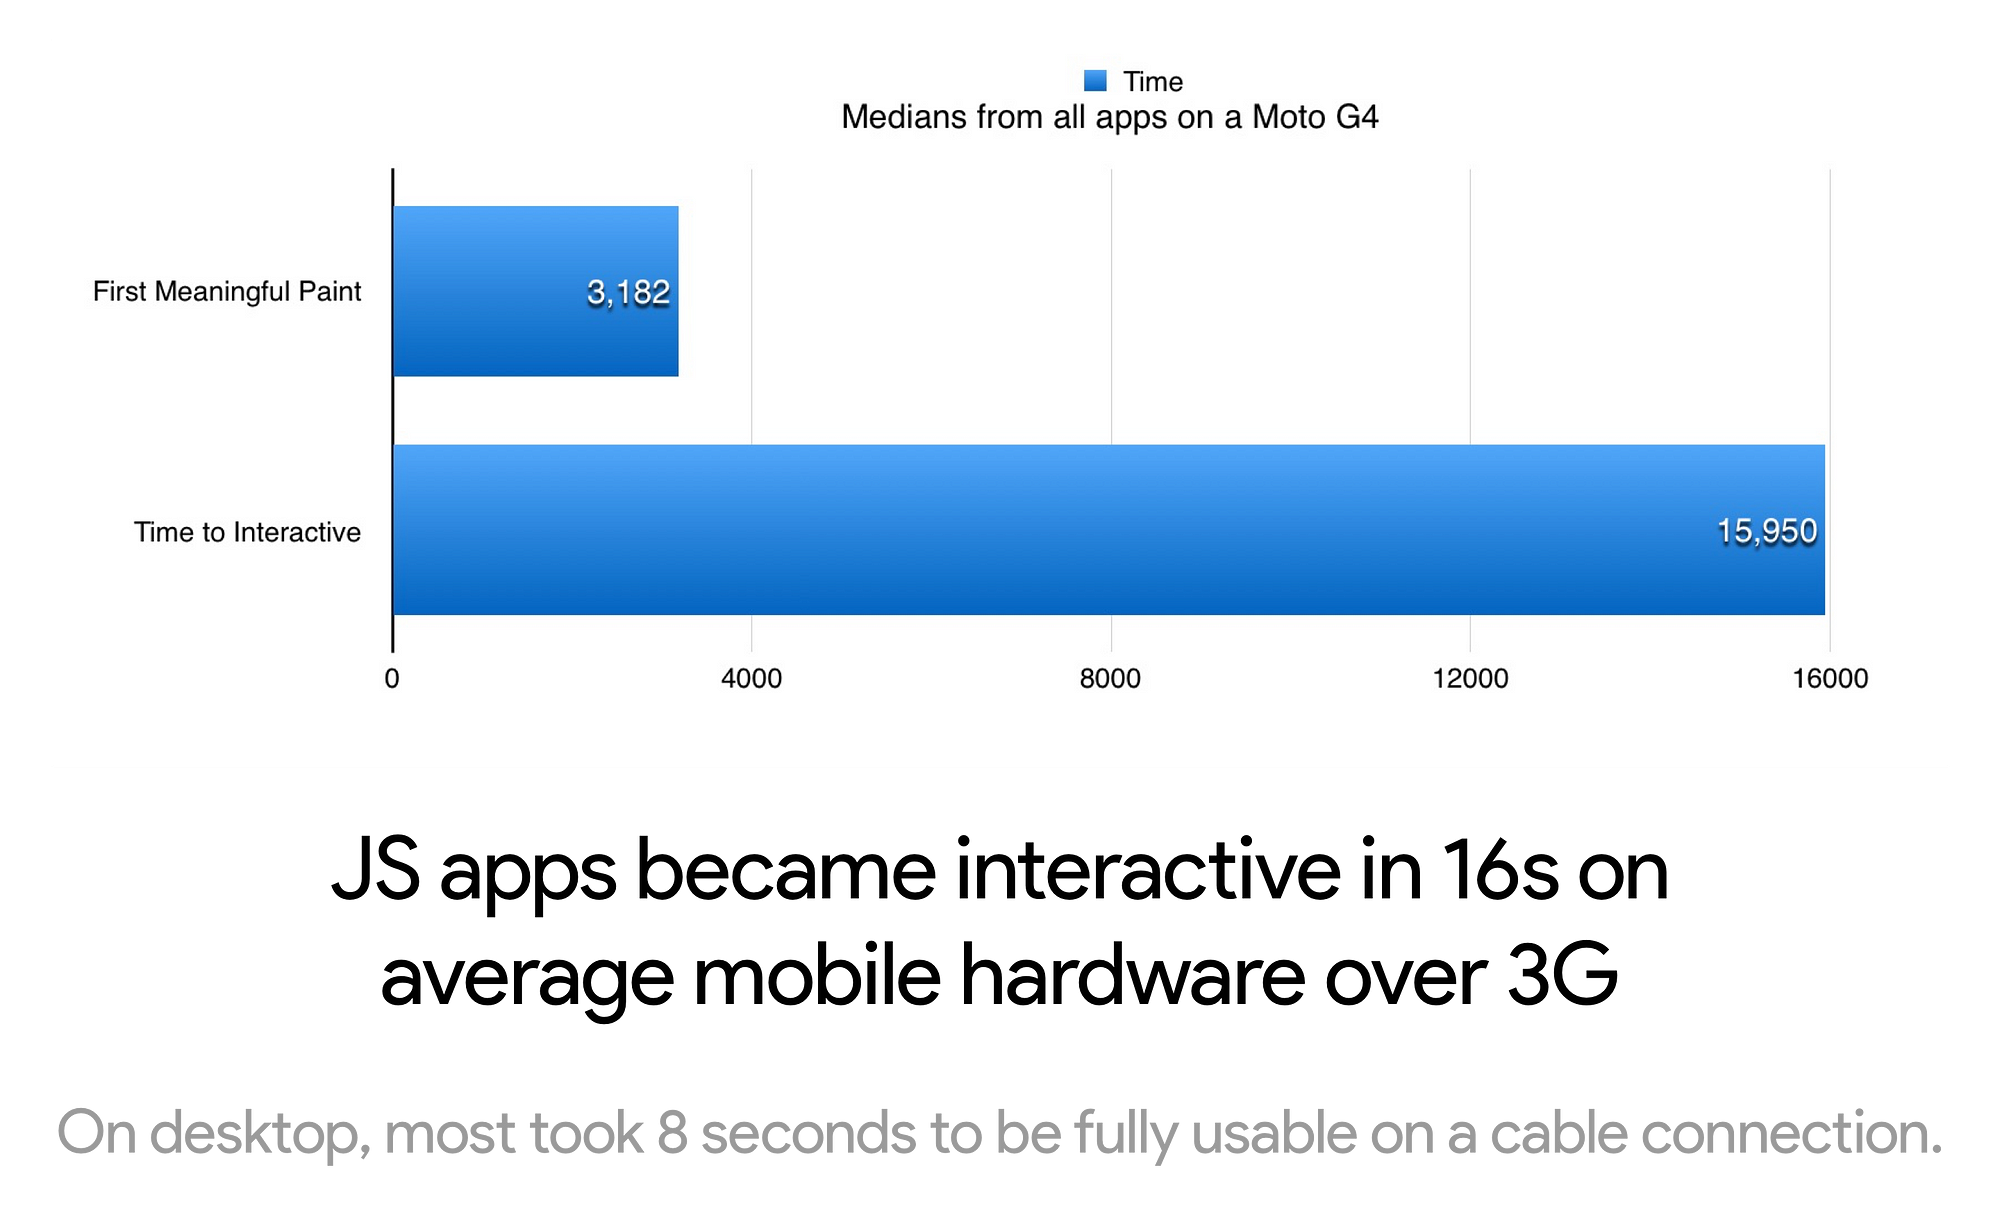
Apps became interactive in 8 seconds on desktop (using cable) and 16 seconds on mobile (Moto G4 over 3G)
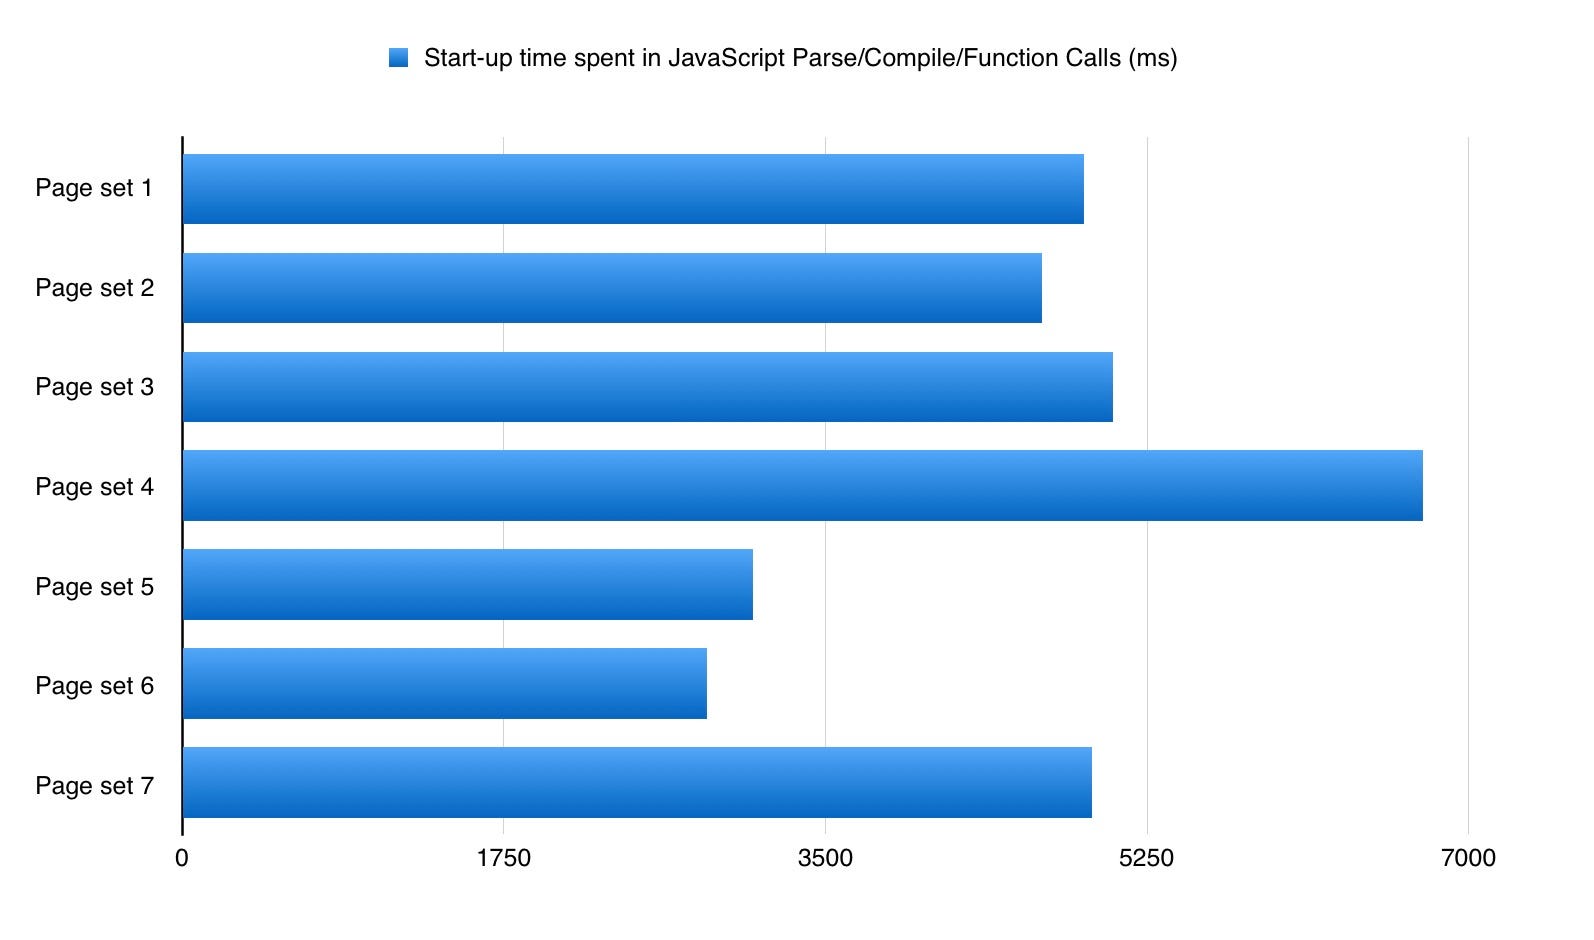
What contributed to this? Most apps spent an average of 4 seconds in start-up (Parse/Compile/Exec)..on desktop.
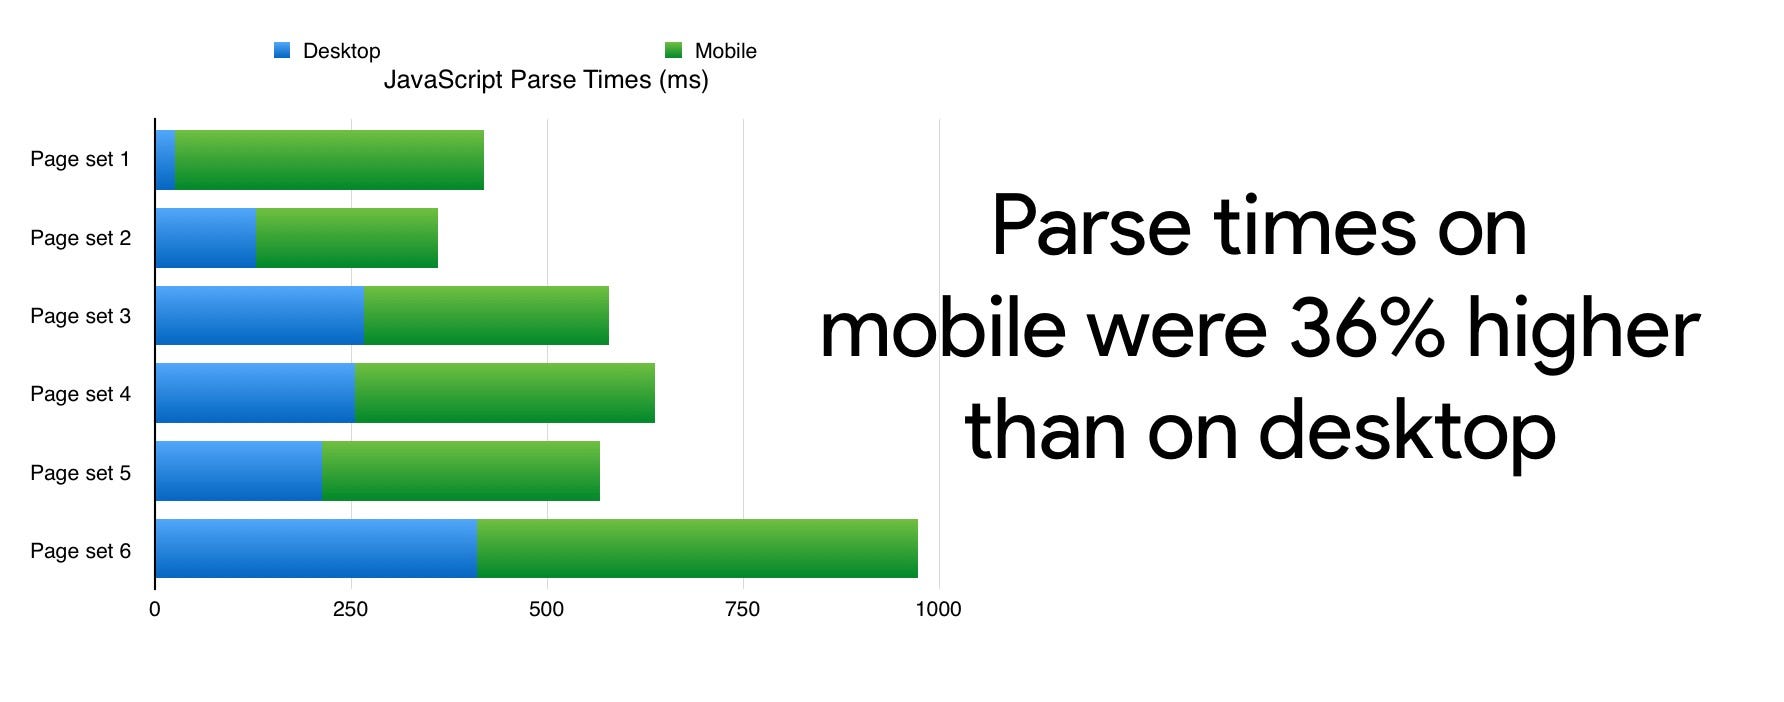
On mobile, parse times were up to 36% higher than they were on desktop.
Was everyone shipping huge JS bundles? Not as large as I had guessed, but there’s room for improvement. At the median, developers shipped 410KB of gzipped JS for their pages. This is in line with the 420KB over ‘average JS per page’ reported by the HTTPArchive. The worst offenders were sending anywhere up to 10MB of script down the wire. Oof.
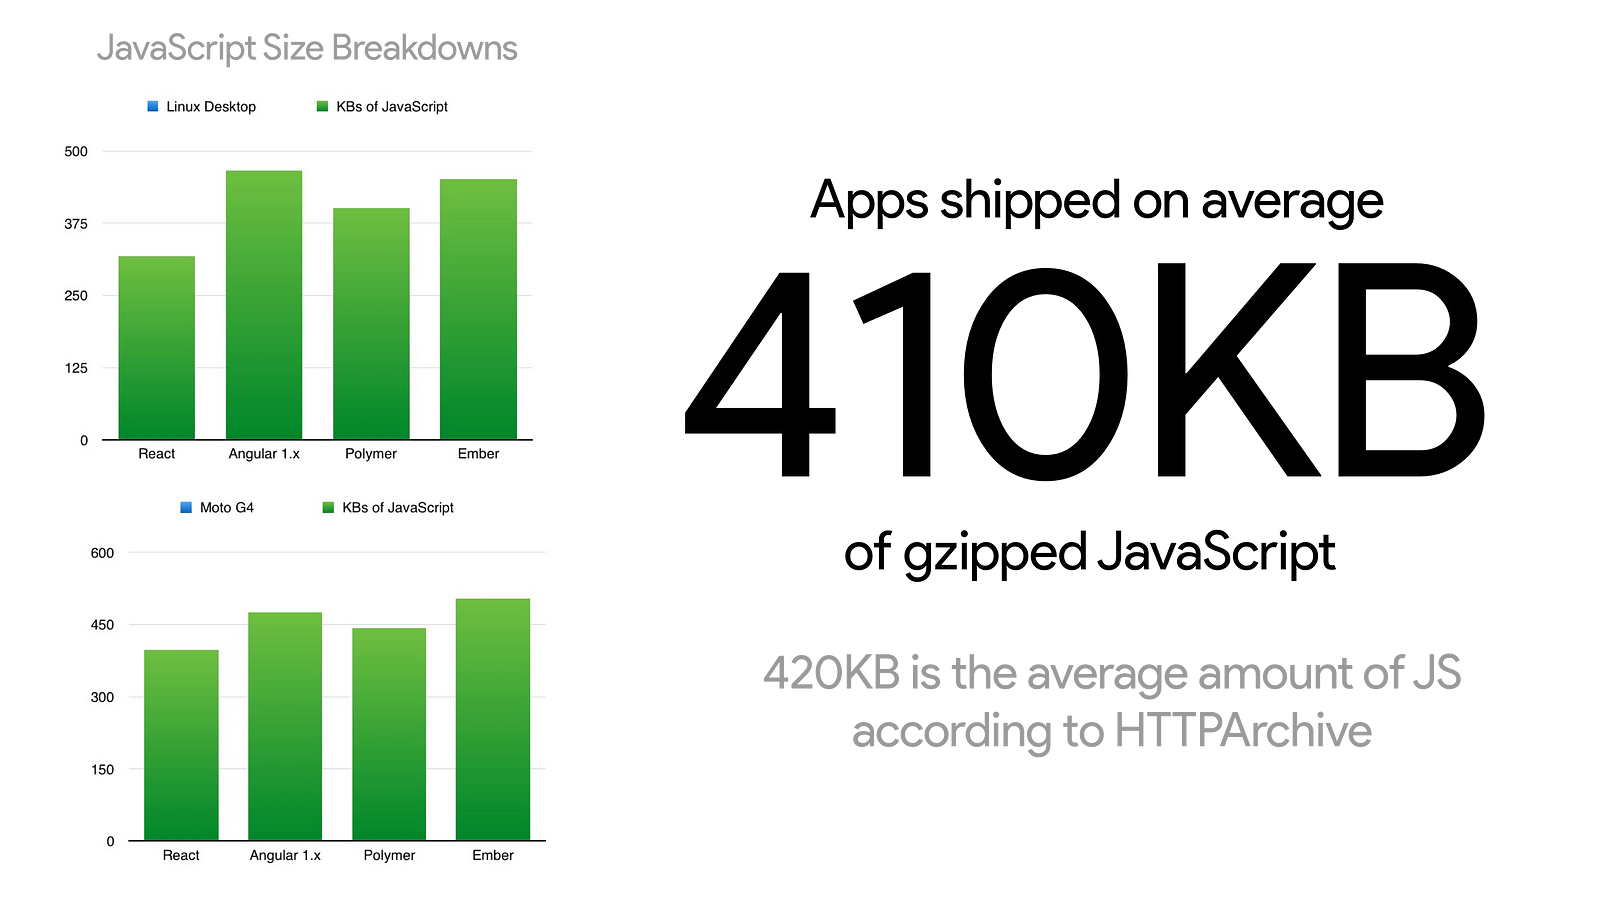 HTTPArchive stat: the average page ships down 420KB of JavaScript
Script size is important, but it isn’t everything. Parse and Compile times don’t necessarily increase linearly when the script size increases. Smaller JavaScript bundles generally do result in a faster load time (regardless of our browser, device & network connection) but 200KB of our JS !== 200KB of someone else’s and can have wildly different parse and compile numbers.
Measuring JavaScript Parse & Compile today
Chrome DevTools
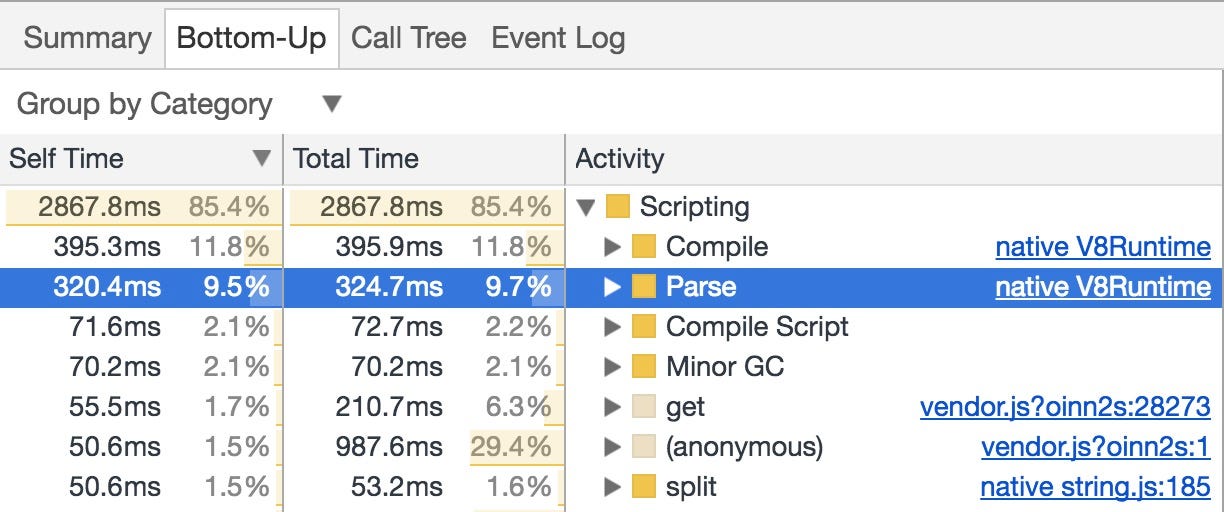
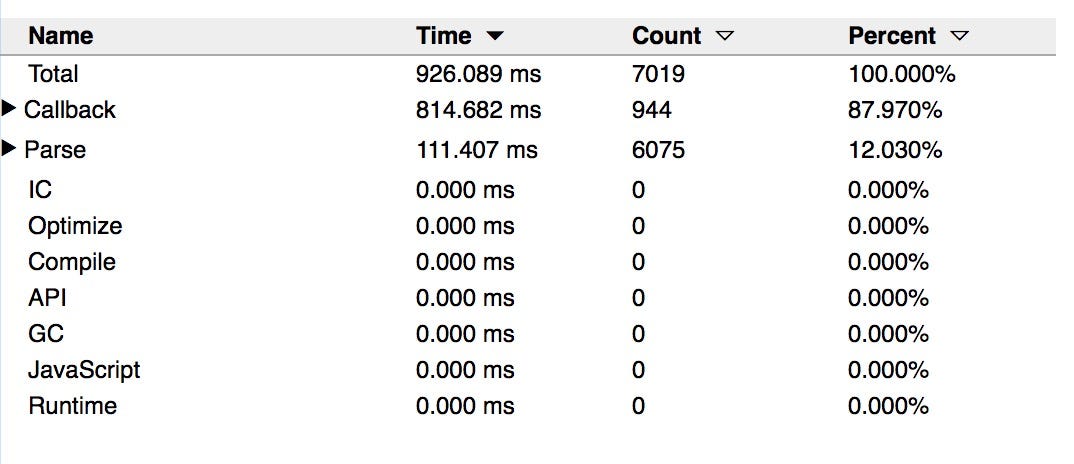
Timeline (Performance panel) > Bottom-Up/Call Tree/Event Log will let us drill into the amount of time spent in Parse/Compile. For a more complete picture (like the time spent in Parsing, Preparsing or Lazy Compiling), we can turn on V8’s Runtime Call Stats. In Canary, this will be in Experiments > V8 Runtime Call Stats on Timeline.
Chrome Tracing
about:tracing — Chrome’s lower-level Tracing tool allows us to use the disabled-by-default-v8.runtime_stats category to get deeper insights into where V8 spends its time. V8 have a step-by-step guide on how to use this that was published just the other day.
WebPageTest
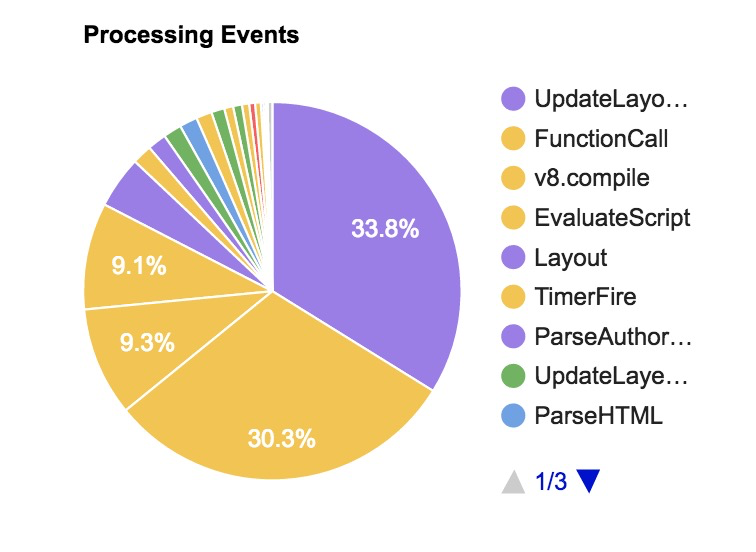
WebPageTest’s “Processing Breakdown” page includes insights into V8 Compile, EvaluateScript and FunctionCall time when we do a trace with the Chrome > Capture Dev Tools Timeline enabled.
We can now also get out the Runtime Call Stats by specifying disabled-by-default-v8.runtime_stats as a custom Trace category (Pat Meenan of WPT now does this by default!).

For a guide on how to get the most out of this, see this gist I wrote up.
User Timing
It’s possible to measure Parse times through the User Timing API as Nolan Lawson points out below:
The third <script> here isn’t important, but it’s the first <script> being separate from the second (performance.mark() starting before the <script> has been reached) that is.
This approach can be affected on subsequent reloads by V8’s preparser. This could be worked around by appending a random string to the end of the script, something Nolan does in his optimize-js benchmarks.
I use a similar approach for measuring the impact of JavaScript Parse times using Google Analytics:
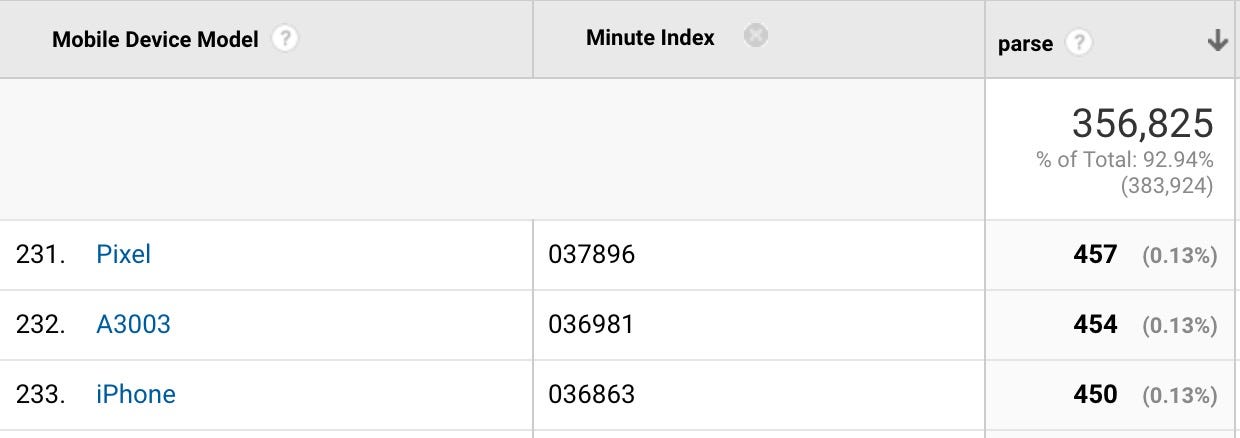 A custom Google Analytics dimension for ‘parse’ allows me to measure JavaScript parse times from real users and devices hitting my pages in the wild.
DeviceTiming
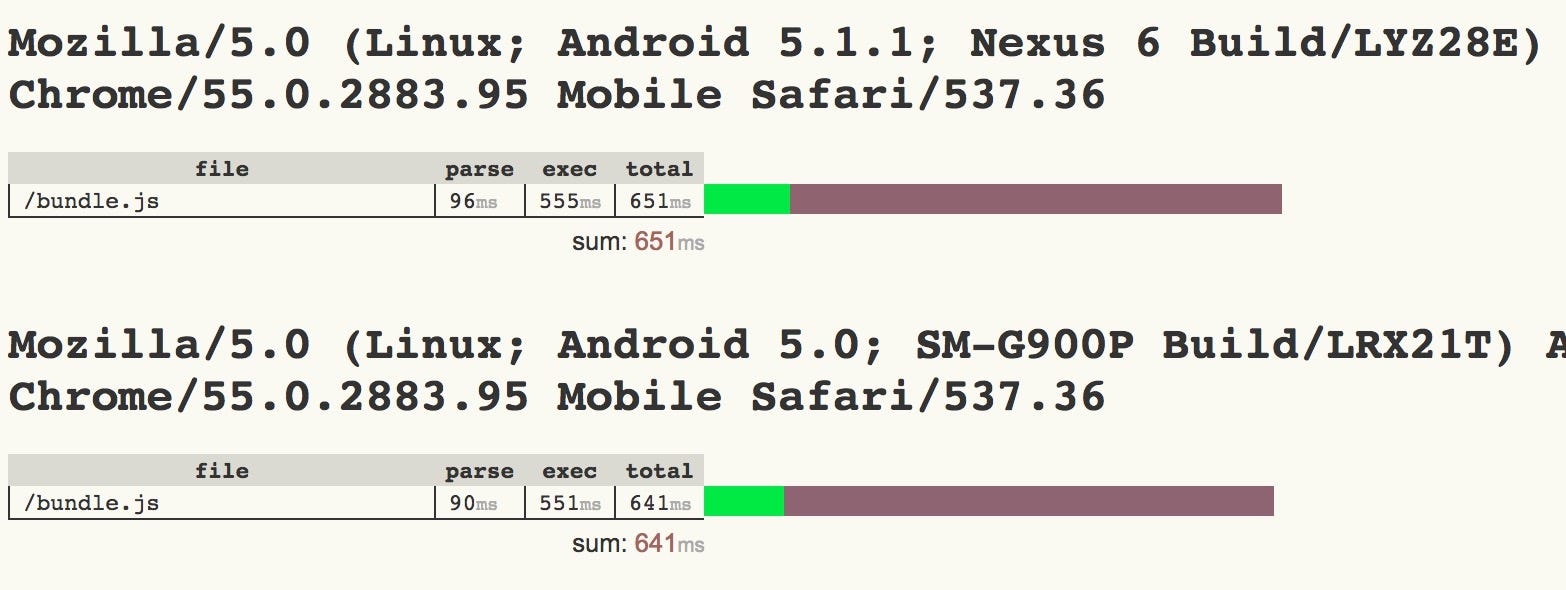
Etsy’s DeviceTiming tool can help measure parse & execution times for scripts in a controlled environment. It works by wrapping local scripts with instrumentation code so that each time our pages are hit from different devices (e.g laptops, phones, tablets) we can locally compare parse/exec. Daniel Espeset’s Benchmarking JS Parsing and Execution on Mobile Devices goes into more detail on this tool.
What can we do to lower our JavaScript parse times today?
- Ship less JavaScript. The less script that requires parsing, the lower our overall time spent in the parse & compile phases will be.
- Use code-splitting to only ship the code a user needs for a route and lazy load the rest. This probably is going to help the most to avoid parsing too much JS. Patterns like PRPL encourage this type of route-based chunking, now used by Flipkart, Housing.com and Twitter.
- Script streaming: In the past, V8 have told developers to use
async/deferto opt into script streaming for parse-time improvements of between 10–20%. This allows the HTML parser to at least detect the resource early, push the work to the script streaming thread and not halt the document parsing. Now that this is done for parser-blocking scripts too, I don’t think there’s anything actionable we need to do here. V8 recommend loading larger bundles earlier on as there’s only one streamer thread (more on this later) - Measure the parse cost of our dependencies, such as libraries and frameworks. Where possible, switch them out for dependencies with faster parse times (e.g switch React for Preact or Inferno, which require fewer bytes to bootup and have smaller parse/compile times). Paul Lewis covered framework bootup costs in a recent article. As Sebastian Markbage has also noted, a good way to measure start-up costs for frameworks is to first render a view, delete and then render again as this can tell you how it scales. The first render tends to warm up a bunch of lazily compiled code, which a larger tree can benefit from when it scales.
If our JavaScript framework of choice supports an ahead-of-time compilation mode (AoT), this can also help heavily reduce the time spent in parse/compile. Angular apps benefit from this for example:
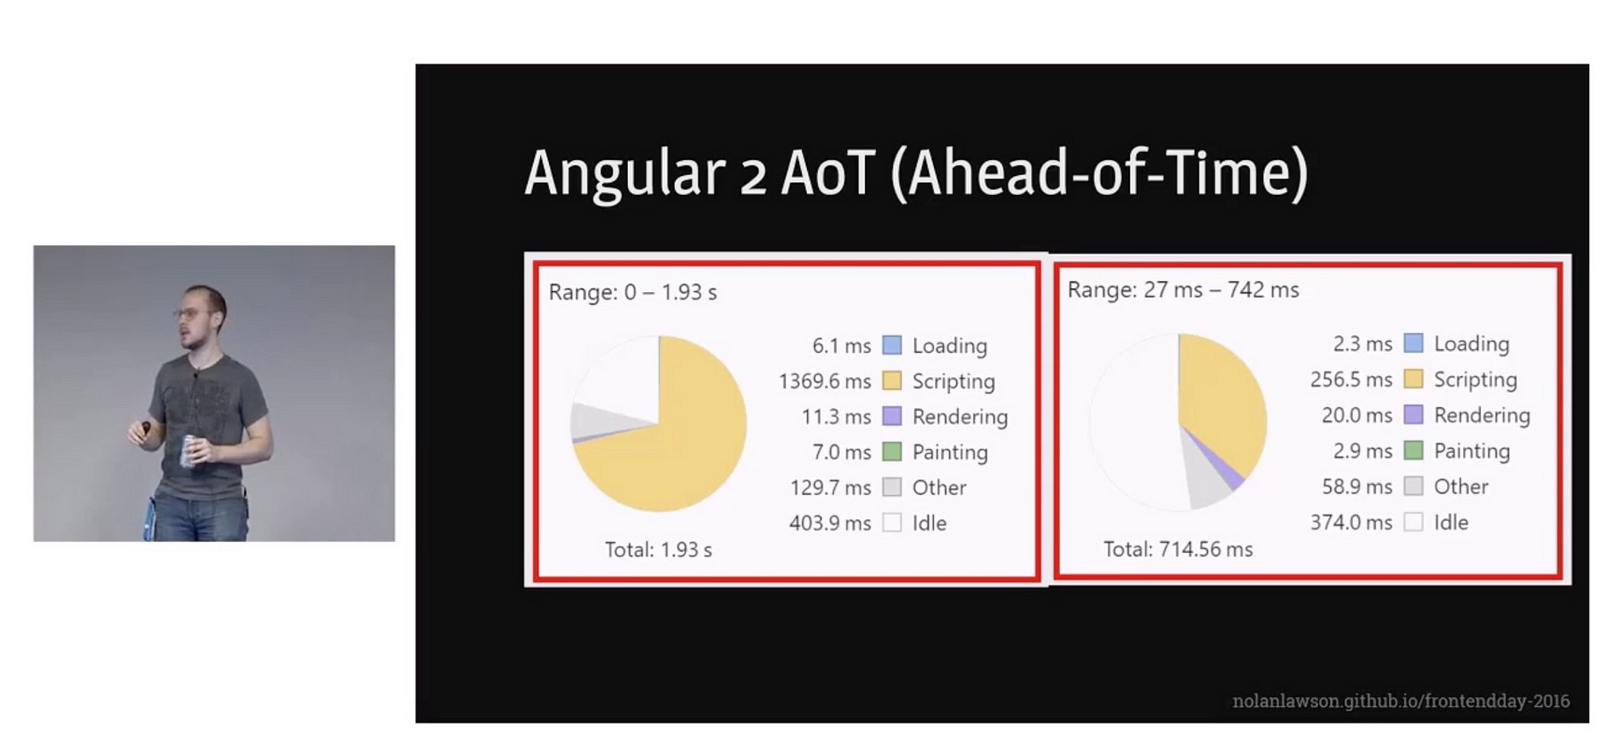 Nolan Lawson’s ‘Solving the Web Performance Crisis’
What are browsers doing to improve Parse & Compile times today?
Developers are not the only ones to still be catching up on real-world start-up times being an area for improvement. V8 discovered that Octane, one of our more historical benchmarks, was a poor proxy for real-world performance on the 25 popular sites we usually test. Octane can be a poor proxy for 1) JavaScript frameworks (typically code that isn’t mono/polymorphic) and 2) real-page app startup (where most code is cold). These two use-cases are pretty important for the web. That said, Octane isn’t unreasonable for all kinds of workloads.
The V8 team has been hard at work improving start-up time and we’ve already seem some wins here:
We also estimate a 25% improve on V8 parse times for many pages looking at our Octane-Codeload numbers:
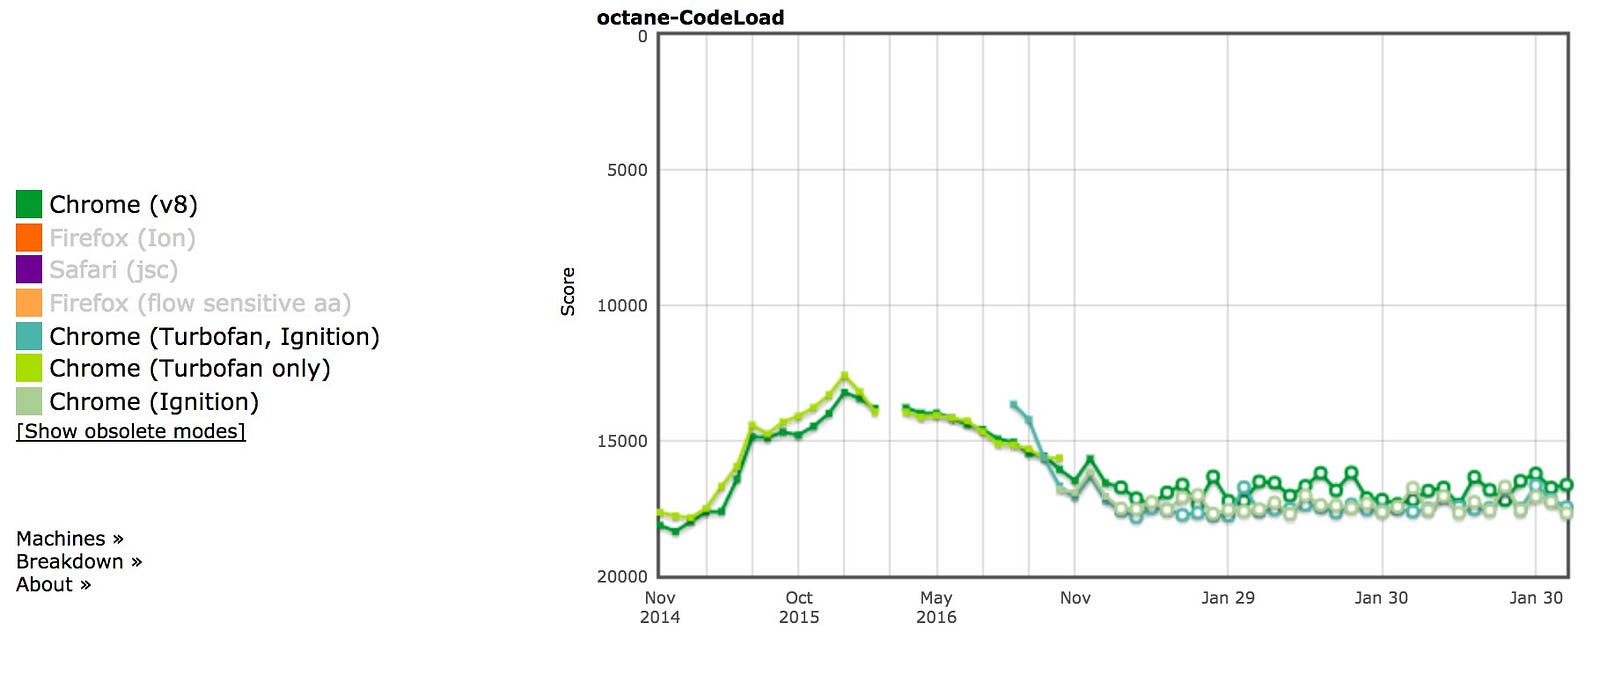
And we’re seeing wins in this area for Pinterest too. There are a number of other explorations V8 has started over the last few years to improve Parsing and Compile times.
Code caching
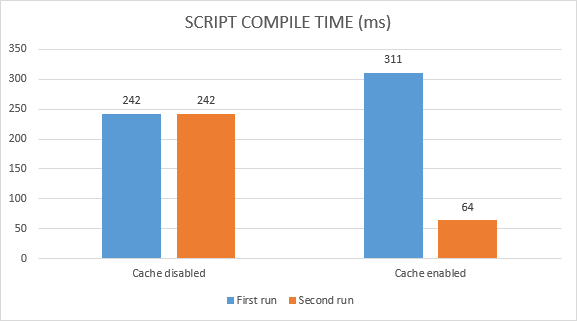
Chrome 42 introduced code caching — a way to store a local copy of compiled code so that when users returned to the page, steps like script fetching, parsing and compilation could all be skipped. At the time we noted that this change allowed Chrome to avoid about 40% of compilation time on future visits, but I want to provide a little more insight into this feature:
- Code caching triggers for scripts that are executed twice in 72 hours.
- For scripts of Service Worker: Code caching triggers for scripts that are executed twice in 72 hours.
- For scripts stored in Cache Storage via Service Worker: Code caching triggers for scripts in the first execution.
So, yes. If our code is subject to caching V8 will skip parsing and compiling on the third load.
We can play around with these in chrome://flags/#v8-cache-strategies-for-cache-storage to look at the difference. We can also run Chrome with — js-flags=profile-deserialization to see if items are being loaded from the code cache (these are presented as deserialization events in the log).
One caveat with code caching is that it only caches what’s being eagerly compiled. This is generally only the top-level code that’s run once to setup global values. Function definitions are usually lazily compiled and aren’t always cached. IIFEs (for users of optimize-js ;)) are also included in the V8 code cache as they are also eagerly compiled.
Script Streaming
Script streaming allows async or defer scripts to be parsed on a separate background thread once downloading begins and improves page loading times by up to 10%. As noted earlier, this now also works for sync scripts.
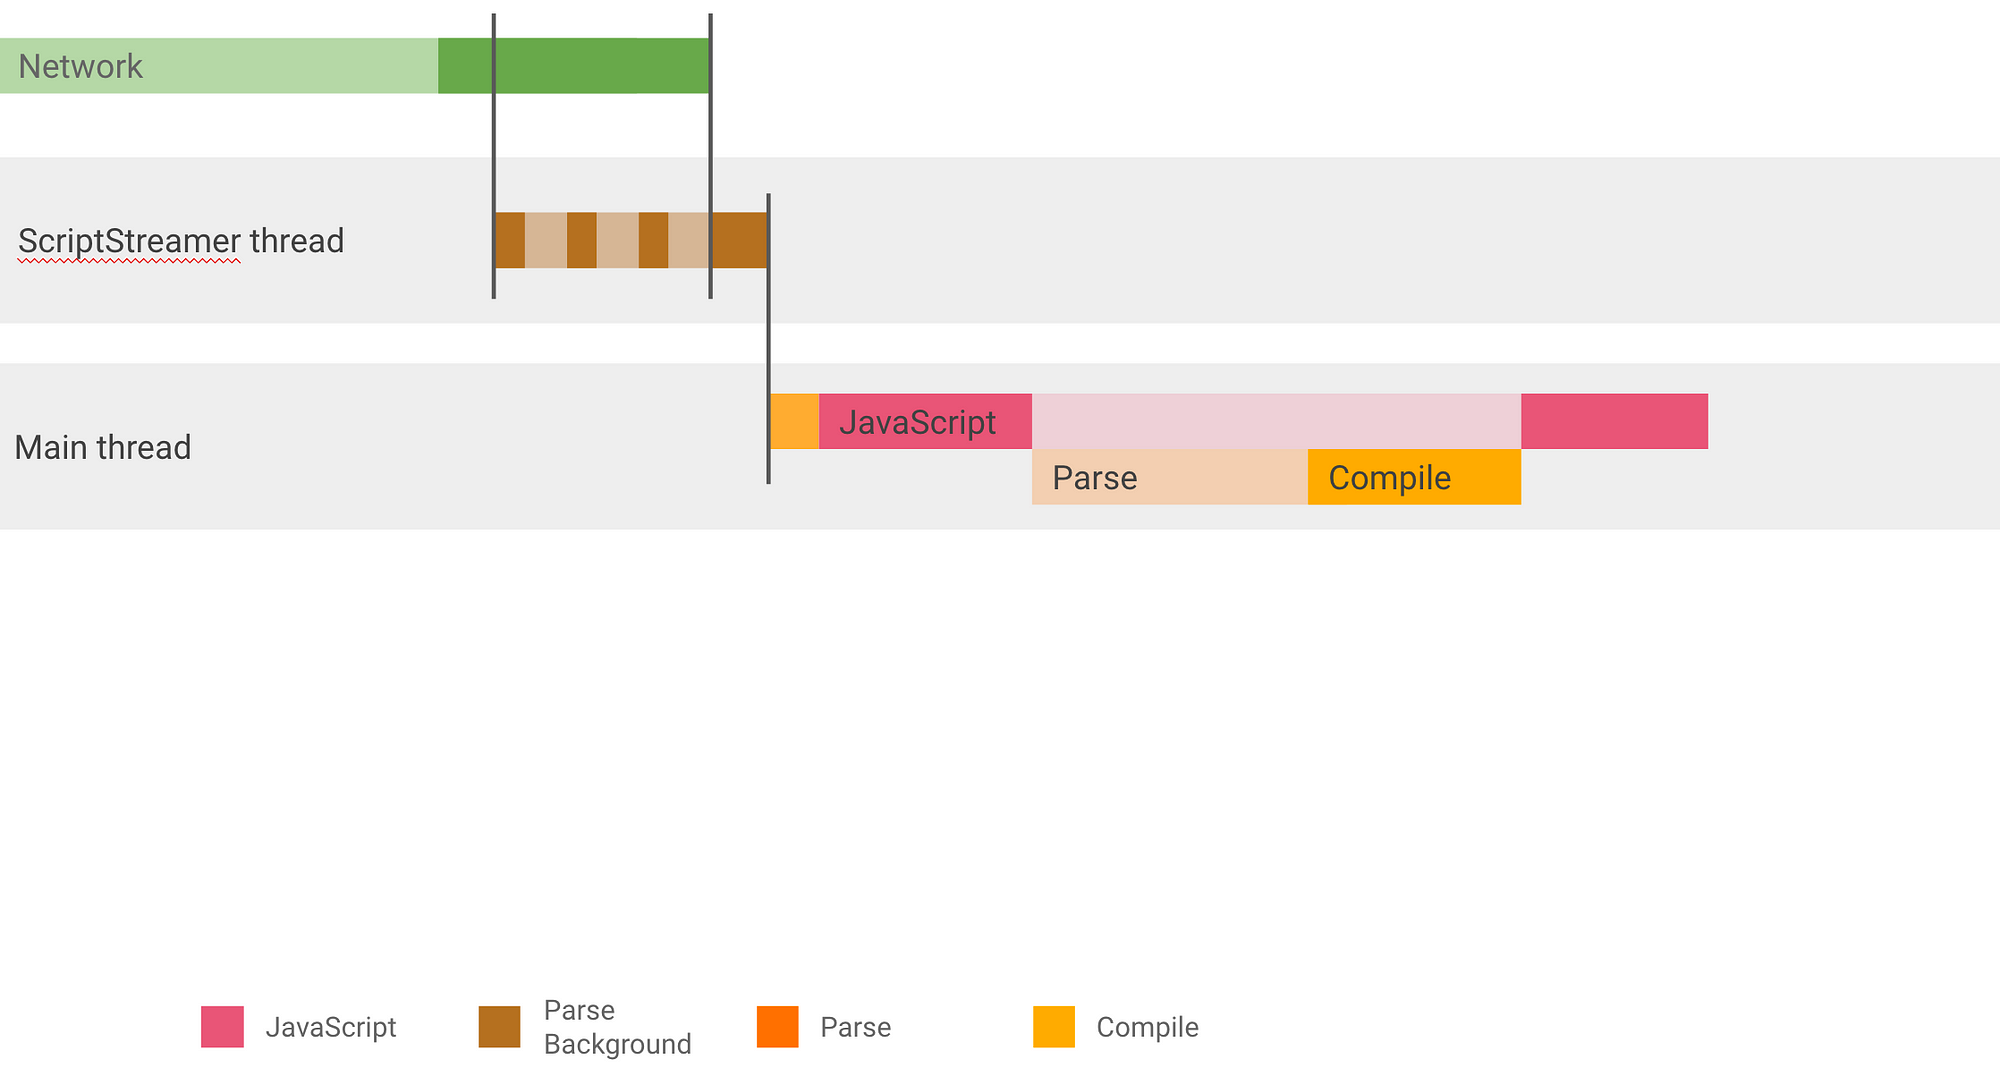
Since the feature was first introduced, V8 have switched over to allowing all scripts, even parser blocking <script src=””> to be parsed on a background thread so everyone should be seeing some wins here. The only caveat is that there’s only one streaming background thread and so it makes sense to put our large/critical scripts in here first. It’s important to measure for any potential wins here.
Practically, <script defer> in the <head> so we can discover the resource early and then parse it on the background thread.
It’s also possible to check with DevTools Timeline whether the correct scripts get streamed — if there’s one big script that dominates the parse time, it would make sense to make sure it’s (usually) picked up by the streaming.

Better Parsing & Compiling
Work is ongoing for a slimmer and faster Parser that frees up memory and is more efficient with data structures. Today, the largest cause of main thread jank for V8 is the nonlinear parsing cost. Take a snippet of UMD:
(function (global, **module**) { … })(this, function **module**() { _my functions_ })
V8 won’t know that module is definitely needed so we won’t compile it when the main script gets compiled. When we decide to compile module, we need to reparse all of the inner functions. This is what makes V8’s parse-times non-linear. Every function at n-th depth is parsed n times and causes jank.
V8 are already working on collecting info about inner functions during the initial compile, so any future compilations can ignore their inner functions. For module-style functions, this should result in a large perf improvement.
See ‘The V8 Parser(s) — Design, Challenges, and Parsing JavaScript Better’ for the full story.
V8 are also exploring offloading parts of JavaScript compilation to the background during startup.
Precompiling JavaScript?
Every few years, it’s proposed engines offer a way to precompile scripts so we don’t waste time parsing or compiling code pops up. The idea is if instead, a build-time or server-side tool can just generate bytecode, we’d see a large win on start-up time. My opinion is shipping bytecode can increase your load-time (it’s larger) and you would likely need to sign the code and process it for security. V8’s position is for now we think exploring avoiding reparsing internally will help see a decent enough boost that precompilation may not offer too much more, but are always open to discussing ideas that can lead to faster startup times. That said, V8 are exploring being more aggressive at compiling and code-caching scripts when you update a site in a Service Worker and we hope to see some wins with this work.
We discussed precompilation at BlinkOn 7 with Facebook and Akamai and my notes can be found here.
The Optimize JS lazy-parsing parens ‘hack’
JavaScript engines like V8 have a lazy parsing heuristic where they pre-parse most of the functions in our scripts before doing a complete round of parsing (e.g to check for syntax errors). This is based on the idea that most pages have JS functions that are lazily executed if at all.
Pre-parsing can speed up startup times by only checking the minimal a browser needs to know about functions. This breaks down with IIFEs. Although engines try to skip pre-parsing for them, the heuristics aren’t always reliable and this is where tools like optimize-js can be useful.
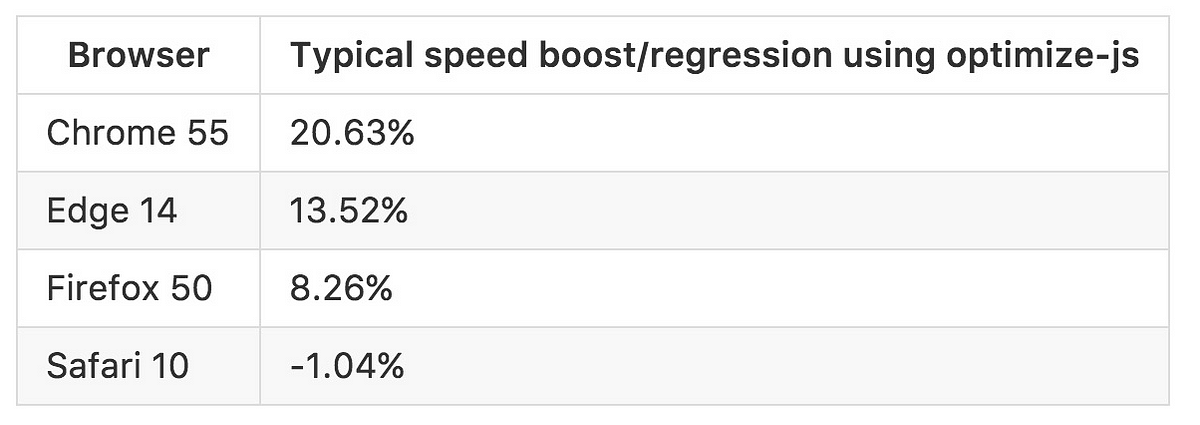
optimize-js parses our scripts in advance, inserts parenthesis where it knows (or assumes via heuristics) functions will be immediately executed enabling faster execution. Some of the paren-hacked functions are sure bets (e.g IIFEs with !). Others are based on heuristics (e.g in a Browserify or Webpack bundle it’s assumed all modules are eagerly loaded which isn’t necessarily the case). Eventually, V8 hopes for such hacks to not be required but for now this is an optimization we can consider if we know what you’re doing.
V8 are also working on reducing the cost for cases where we guess wrong, and that should also reduce the need for the parens hack
Conclusions
Start-up performance matters. Acombination of slow parse, compile and execution times can be a real bottleneck for pages that wish to boot-up quickly. Measure how long your pages spend in this phase. Discover what you can do to make it faster.
We’ll keep working on improving V8 start-up performance from our end as much as we can. We promise ;) Happy perfing!
Read More
- Planning for Performance
- Solving the Web Performance Crisis by Nolan Lawson
- JS Parse and Execution Time
- Measuring Javascript Parse and Load
- Unpacking the Black Box: Benchmarking JS Parsing and Execution on Mobile Devices (slides)
- When everything’s important, nothing is!
- The truth about traditional JavaScript benchmarks
- Do Browsers Parse JavaScript On Every Page Load
With thanks to V8 (Toon Verwaest, Camillo Bruni, Benedikt Meurer, Marja Hölttä, Seth Thompson), Nolan Lawson (MS Edge), Malte Ubl (AMP), Tim Kadlec (Synk), Gray Norton (Chrome DX), Paul Lewis, Matt Gaunt and Rob Wormald (Angular) and for their reviews of this article.
Update: Thanks to some awesome members of the community, this article is now available in Chinese and Russian too.
 From
From